プレゼン資料の作り方 初心者向け
How to prepare the presentation file ? (for beginner)
ver 1.1 (13 Sep 2021, by nogi)
ver 1.0 (28 Sep 2019, by nogi)
1.一般的なコメント/General comments
1-1. Keep the same term
術語の統一
1-2. No abbreviations
略称の使用禁止
1-3. No question & negative sentences
疑問文・否定文禁止
1-4. simple is the best
シンプルが一番
1-5. one page, one message
1ページで1メッセージ
1-6. Light file size !! (100-200kB/page, enough )
容量は小さく。1枚100-200kBで十二分
http://www.nogimasaya.com/favorite/reduce/
1-7. No animation
アニメーションはNG
1-8. Write “page/total page”. How long ? Now, where are we?
ページ数/総ページ数を記載
2.概要説明から/ start from the abstract
Any report starts from the outline or abstract, which simply explain what you did & not yet. Of course, you will prepare the outline page, finally. However, after you will prepare the outline, you will check again your outline completely match with the following contents. At that time, you must consider your story structure, again. The first structure is never perfect, should be the worst !
どんな文書も、完了・未完了など、概要・状況説明からスタートします。もちろん、概要説明ページは、最後に準備します。しかし、概要説明ページを準備したら、そのページとそれに続く詳細説明ページの内容が一致しているか、再びチェックしてください。その時、ストーリーの再構成を忘れないこと。最初からストーリーが完璧なんてありえず、どちらと言うと最初のストーリーは最悪です。
3.ページ最上部に結論 /At the top, write the conclusion
Key message is on the top, not the bottom. Never, “method, results, and conclusion” set on the top !! Moreover, no question & negative sentences.
キーメッセージをトップに記載する。トップに「実験方法・結果・結論」などを書かない。さらに、疑問文や否定文を使わない。
From “Measure A”, do you understand what the author want to tell us?
From “Compare A & B”, do you understand what the author want to tell us?
From “Which is larger among A-C ?”, what do you understand?
From “C is not the largest” , what do you understand?
「Aを測定した」という文章から、何が分かりますか?満足できますか?
「AとBを比較した」という文章から、何が分かりますか?満足できますか?
「A-Cで、どれが最大でしょう?」から、何が分かりますか?満足できますか?
「Cは最大ではない」から、何が分かりますか?
4.方法・結果・考察の順番/Order in the method, results, and discussion
NG「方法1→方法2→結果1→結果2→考察1→考察2」
OK「方法1→結果1→考察1→方法2→結果2→考察2」
5.目次/Contents
No need content page.
目次ページ不要
6.実験方法 / Material&Method
“Materials & Methods” are explain by pictures, not text.
実験方法は、写真で説明。文章NG
Pictures should be cropped, not use the original pictures.
写真はトリミングして使用。撮影したオリジナル写真NG
http://www.nogimasaya.com/favorite/reduce/
7. Write the caption for all the graph & tables. グラフ・表にキャプションを書く
caption is top in the table, bottom in the graph)
キャプションは、表の上、グラフの下
8.レイアウト / layout
Left Chart & Right Texts (No, center chart & edge text)
グラフと説明文は、同じ広さで。(例えば、グラフ左で文章右。グラフ中心で余白に文章はNG)
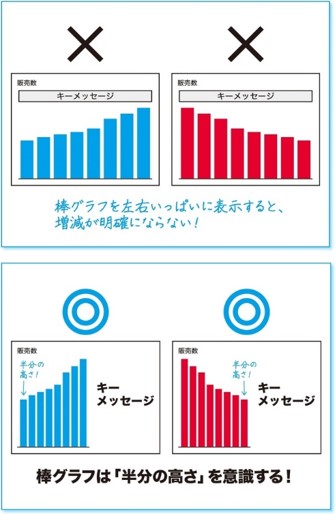
https://diamond.jp/articles/-/77496
9. All the results in the end of Appendix / 全ての結果を末尾資料に記載
You must consider which is better of graph or table to explain your opinion?
When you prepare the graph, all the results are presented in the table at the end of Appendix.
結論・考察を伝えるために、グラフと表、どちからが好ましいか熟慮してください。
グラフを作った際は、オリジナルデータを末尾資料に記載してください。
© Department of Functionalized Natural Materials ISIR, Osaka University


